このページの内容は最新ではありません。最新版の英語を参照するには、ここをクリックします。
計測と統計
2 つの状態レベルの波形計測、分散、ヒストグラム、自己相関
DSP System Toolbox™ のブロックおよび System object を使用して、MATLAB® と Simulink® で信号の移動統計および定常統計を測定することができます。"移動統計" とは、時間と共に変化するストリーミング信号の統計を指します。移動統計を計算するためのスライディング ウィンドウ法では、新しいデータが入ると、指定の長さのウィンドウがサンプルごとにデータを移動します。オブジェクトとブロックにより、このウィンドウ内のデータの統計が計算されます。指数の重み付け法により、一連の重みがデータ サンプルに適用され、重み付けされたデータが処理されます。これらの重みは、データの持続期間に基づいて再帰的に計算されます。定常統計では、ブロックとオブジェクトによってバッチで使用できるすべてのデータの統計が計算されます。
オブジェクト
ブロック
トピック
移動統計
- What Are Moving Statistics?
Learn how moving statistics are calculated. - スライディング ウィンドウ法と指数の重み付け法
スライディング ウィンドウ法と指数の重み付け法の違いについて学ぶ。 - 移動平均フィルターと FIR フィルターの違いとは
移動平均フィルターは、FIR フィルターの特殊なケースです。 - Measure Statistics of Streaming Signals
Compute the moving average of streaming signals using MATLAB functions and System objects. - Compute Moving Average of Noisy Step Signal
Compare the sliding window averaging method and the exponentially weighted averaging method in Simulink using the Moving Average block. - Compute Moving RMS of Noisy Step Signal
Compute moving RMS using both the sliding window method and the exponential weighting method. - Compute Moving Standard Deviation of Noisy Square Wave Signal
Compare the sliding window standard deviation method and the exponentially weighted standard deviation method in Simulink using the Moving Standard Deviation block. - Compute Moving Variance of Noisy Square Wave Signal
Compare the sliding window variance method and the exponentially weighted variance method in Simulink using the Moving Variance block.
定常統計
- 平均の計算
Mean ブロックを使用して平均を計算する Simulink モデル例。 - Compute Mean Using Sliding Window
Model a sliding window using the Buffer block. The Mean block use this window to compute the mean. - ランニング平均の計算
Mean ブロックを使用してランニング平均を計算する Simulink モデル例。 - Compute the Maximum
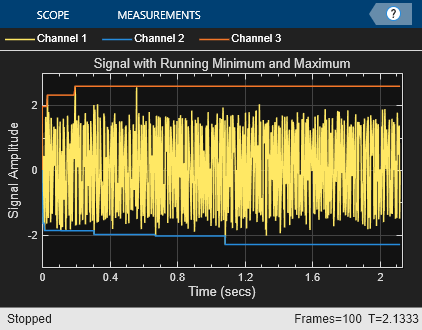
Simulink model example to compute the maximum using the Maximum block. - ランニング最大値の計算
Maximum ブロックを使用してランニング最大値を計算する Simulink モデル例。 - Compute the Minimum
Simulink model example to compute the minimum using the Minimum block. - ランニング最小値の計算
Minimum ブロックを使用してランニング最小値を計算する Simulink モデル例。 - Compute RMS of Noisy Step Signal
Use the RMS block to compute the RMS of a noisy square wave signal. - Compute the Histogram of Real and Complex Data
Simulink model example that explains how the histogram bin boundaries are calculated based on the input. - Compute the Standard Deviation
Use the Standard Deviation block to compute the standard deviation. - ランニング標準偏差の計算
Standard Deviation ブロックを使用してランニング標準偏差を計算します。 - Compute the Variance
Use the Variance block to compute the variance.
パワー測定値
- Compute Power Measurements of Voltage Signal in Simulink
Compute average power, peak power, and peak-to-average power ratio of voltage signal. - Compute CCDF Measurements of Voltage Signal in Simulink
Compute relative power and probability, and plot the CCDF curve in Array Plot.
用途
- ジャイロスコープ データからの高周波数ノイズの除去
メディアン フィルターを使用して高周波数ノイズを除去する。 - Energy Detection in the Time Domain
Detect the event when the signal energy crosses a particular threshold value.
可変サイズ信号のサポート
- Variable-Size Signal Support DSP System Objects
List of System objects that support variable-sized signals in DSP System Toolbox.
注目の例

You can also select a web site from the following list:
Americas
- América Latina (Español)
- Canada (English)
- United States (English)
Europe
- Belgium (English)
- Denmark (English)
- Deutschland (Deutsch)
- España (Español)
- Finland (English)
- France (Français)
- Ireland (English)
- Italia (Italiano)
- Luxembourg (English)
- Netherlands (English)
- Norway (English)
- Österreich (Deutsch)
- Portugal (English)
- Sweden (English)
- Switzerland
- United Kingdom (English)