fsurfht
対話型の等高線図
構文
fsurfht(fun,xlims,ylims)

fsurfht(fun,xlims,ylims,p1,p2,p3,p4,p5)
説明
fsurfht(fun,xlims,ylims) は、テキスト変数 fun で指定する対話形式による関数の等高線図です。x 軸の範囲は [xmin xmax] という形式の xlims によって指定され、y 軸の範囲は [ymin ymax] という形式の ylims によって指定されます。
fsurfht(fun,xlims,ylims,p1,p2,p3,p4,p5) では、関数 fun に対して 5 つのオプションのパラメーターを与えられます。
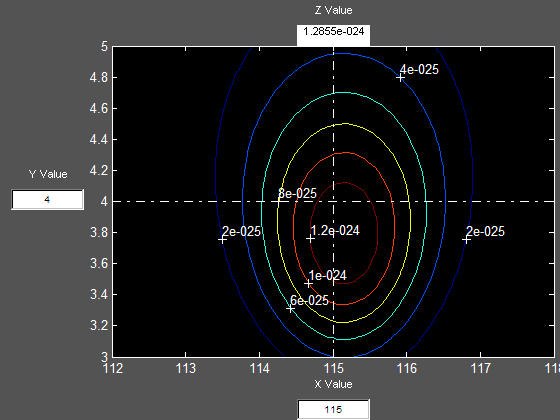
等高線図には垂直方向と水平方向の基準線があり、これらの交点が現在の x の値と y の値を定義します。この基準線をドラッグし、同時に計算される z の値 (等高線図の上部にある) を知ることができます。または、x 軸と y 軸の編集可能なテキスト ボックスに x の値と y の値を入力して z の値を得ることもできます。
例
gas.mat データのガウス尤度関数を示します。
load gas
次のコマンドを含む関数を作成し、gauslike.m と名前を付けます。
function z = gauslike(mu,sigma,p1)
n = length(p1);
z = ones(size(mu));
for i = 1:n
z = z .* (normpdf(p1(i),mu,sigma));
end
関数 gauslike は、データ標本を固定のものとし、パラメーター µ と σ を変数として取り扱う normpdf を呼び出します。ガソリンの価格は、正規分布に従うと仮定し、標本の尤度曲面を示します。
fsurfht('gauslike',[112 118],[3 5],price1)

標本平均は、最大値で x の値ですが、標本の標準偏差は、最大値での y の値にはなりません。
mumax = mean(price1)
mumax =
 115.1500
sigmamax = std(price1)*sqrt(19/20)
sigmamax =
  3.7719
バージョン履歴
R2006a より前に導入
