colormap
現在のカラーマップの表示と設定
構文
説明
カラーマップの設定
cmap = colormap(___)cmap を指定します。
例
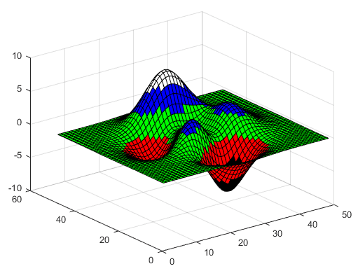
Figure のカラーマップを変更
表面プロットを作成し、カラーマップを winter に設定します。
surf(peaks)
colormap winter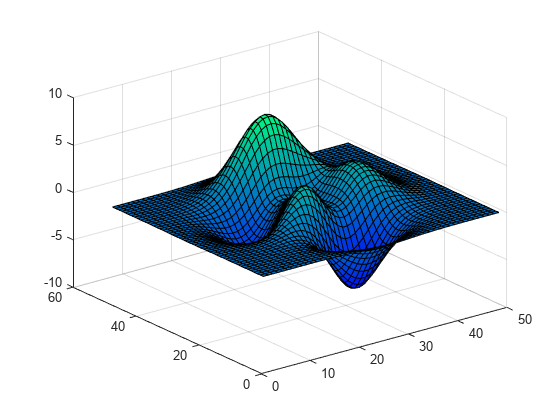
既定のカラーマップに戻す
まず、現在の Figure のカラーマップを summer に変更します。
surf(peaks)
colormap summer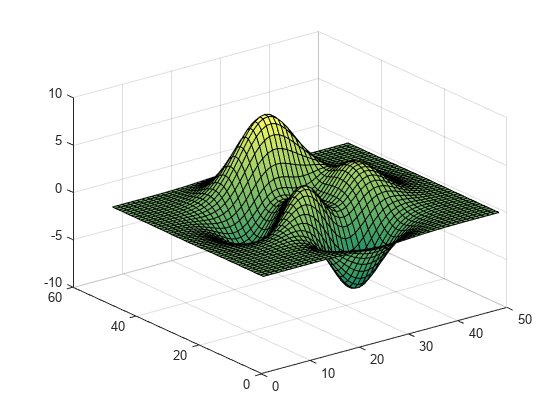
次に、カラーマップをシステムの既定値に戻します。別の既定値を指定していない限り、既定のカラーマップは parula です。
colormap default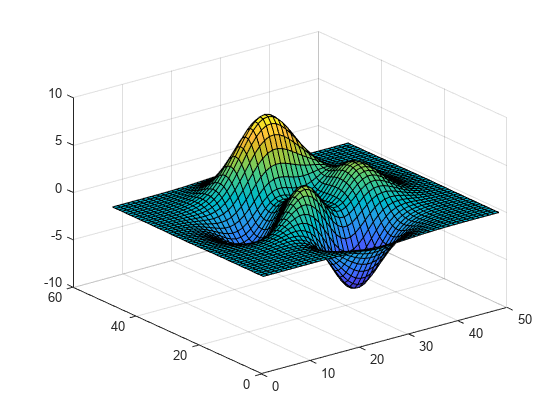
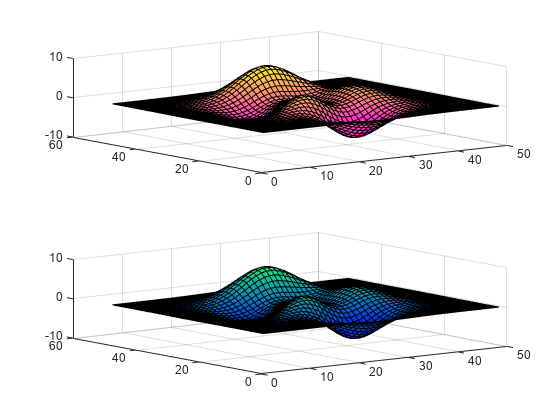
Figure 内の座標軸ごとに異なるカラーマップを使用
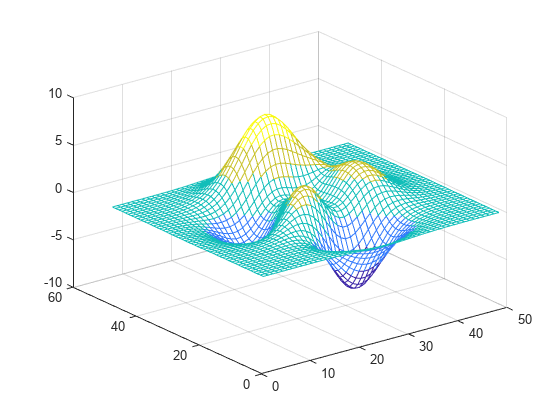
R2019b 以降、関数 tiledlayout および nexttile を使用して、プロットをタイル表示できます。関数 tiledlayout を呼び出して、2 行 1 列のタイル表示チャート レイアウトを作成します。関数 nexttile を呼び出して、axes オブジェクト ax1 および ax2 を作成します。関数 colormap に axes オブジェクトを渡して、座標軸ごとに異なるマップを指定します。上の座標軸では、spring カラーマップを使用して表面プロットを作成します。下の座標軸では、winter カラーマップを使用して表面プロットを作成します。
tiledlayout(2,1)
ax1 = nexttile;
surf(peaks)
colormap(ax1,spring)

ax2 = nexttile;
surf(peaks)
colormap(ax2,winter)
カラーマップの色の数を指定
組み込みのカラーマップに入力引数として整数を渡し、カラーマップの使用する色の数を指定します。parula カラーマップの色を 5 つ使用します。
mesh(peaks)
colormap(parula(5))
カスタムのカラーマップを作成
0.0 ~ 1.0 の範囲の値から成る 3 列の行列を定義して、カスタムのカラーマップを作成します。各行で RGB 3 成分を定義します。1 列目に赤の強度を指定します。2 列目に緑の強度を指定します。3 列目に青の強度を指定します。
最初の 2 列をゼロに設定して、青の値のカラーマップを使用します。
map = [0 0 0.3
    0 0 0.4
    0 0 0.5
    0 0 0.6
    0 0 0.8
    0 0 1.0];

surf(peaks)
colormap(map)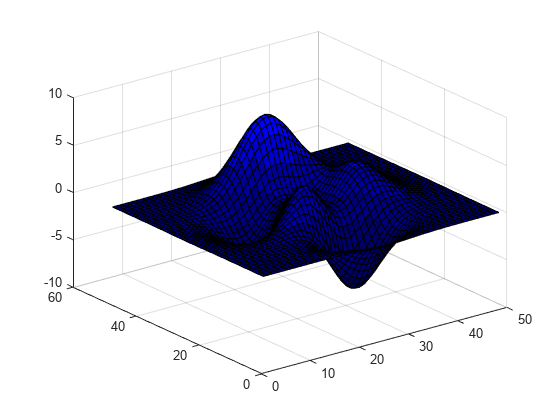
プロットで使用されているカラーマップの値を返す
関数 peaks の表面プロットを作成し、カラーマップを指定します。
mesh(peaks)
colormap(autumn(5))
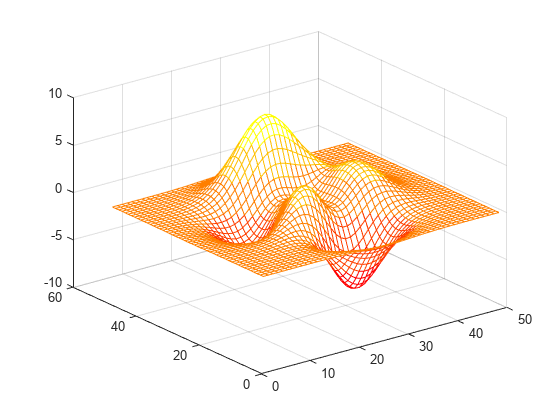
プロットで使用されている色を定義する値の 3 列の行列を返します。各行に、カラーマップの 1 つの色を示す RGB 3 成分の値が 1 つずつ格納されます。
cmap = colormap
cmap = 5×3

    1.0000         0         0
    1.0000    0.2500         0
    1.0000    0.5000         0
    1.0000    0.7500         0
    1.0000    1.0000         0
特定の座標軸のカラーマップの値を返す
関数 colormap に axes オブジェクトを渡して、特定の座標軸のカラーマップの値を返します。
R2019b 以降の新しい関数である関数 tiledlayout および nexttile を使用して、2 つのプロットのタイル配置を作成します。関数 tiledlayout を呼び出して、2 行 1 列のタイル表示チャート レイアウトを作成します。関数 nexttile を呼び出して、axes オブジェクト ax1 および ax2 を作成します。次に、別々のカラーマップをもつ 2 つの塗りつぶし等高線図を表示します。
tiledlayout(2,1)
ax1 = nexttile;
contourf(peaks)
colormap(ax1,hot(8))

ax2 = nexttile;
contourf(peaks)
colormap(ax2,pink)
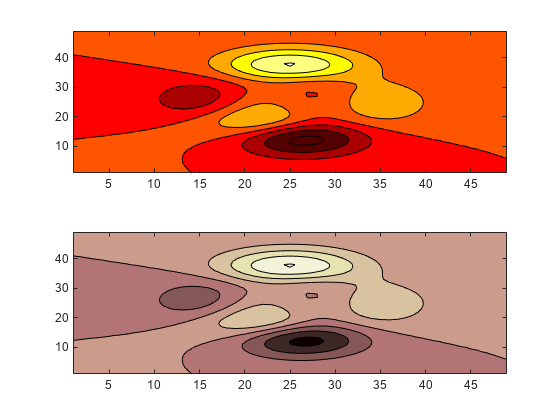
関数 colormap に ax1 を渡して、上のプロットで使用したカラーマップの値を返します。各行に、カラーマップの 1 つの色を示す RGB 3 成分の値が 1 つずつ格納されます。
cmap = colormap(ax1)
cmap = 8×3

    0.3333         0         0
    0.6667         0         0
    1.0000         0         0
    1.0000    0.3333         0
    1.0000    0.6667         0
    1.0000    1.0000         0
    1.0000    1.0000    0.5000
    1.0000    1.0000    1.0000
イメージが表示された Figure のカラーマップを変更
イメージ X とそれに関連付けられたカラーマップ map を返す spine データ セットを読み込みます。関数 image を使用して X を表示し、カラーマップを map に設定します。
load spine
image(X)
colormap(map)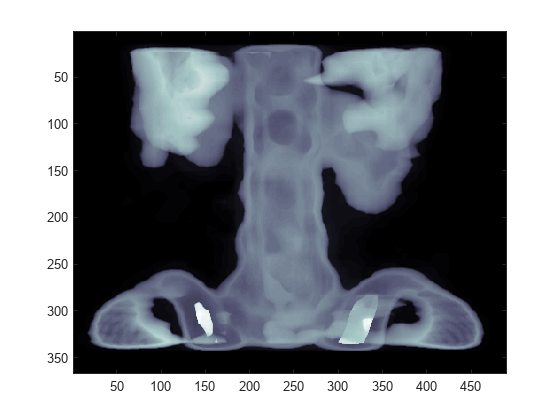
入力引数
map — 新しいカラー スキームのカラーマップ
カラーマップの名前 | RGB 3 成分から成る 3 列の行列 | 'default'
新しいカラー スキームのカラーマップ。カラーマップの名前、RGB 3 成分から成る 3 列の行列、または 'default' として指定します。カラーマップの名前は、現在のカラーマップと同じ数の色をもつ事前定義されたカラーマップを指定します。RGB 3 成分から成る 3 列の行列は、カスタムのカラーマップを指定します。独自の行列を作成できます。あるいは、事前定義されたカラーマップ関数のいずれかを呼び出して行列を作成することもできます。たとえば、colormap(parula(10)) は、現在の Figure のカラーマップを parula カラーマップから選択した 10 色に設定します。
'default' の値は、ターゲット オブジェクトのカラーマップを既定のカラーマップに設定します。
カラーマップの名前
次の表に事前定義されたカラーマップを示します。
| カラーマップの名前 | カラー スケール |
|---|---|
|
|
|
|
|
|
|
|
|
|
|
|
|
|
|
|
|
|
|
|
|
|
|
|
|
|
|
|
|
|
|
|
|
|
|
|
|
|
|
|
|
|


3 列の行列
カスタムのカラーマップを作成するには、map に RGB 3 成分から成る 3 列の行列を指定し、各行で 1 つの色を定義します。RGB 3 成分は、色の赤、緑、青成分の強度を指定する 3 成分の行ベクトルです。強度値は範囲 [0, 1] の double 値または single 値か、範囲 [0, 255] の uint8 の値にすることができます。たとえば次の行列では 5 色のカラーマップを定義しています。
map = [0.2 0.1 0.5
    0.1 0.5 0.8
    0.2 0.7 0.6
    0.8 0.7 0.3
    0.9 1 0];
次の表に一般的な色に対応する RGB 3 成分の値を示します。
| 色 | double または single の RGB 3 成分 | uint8 の RGB 3 成分 |
|---|---|---|
| 黄 | [1 1 0] | [255 255 0] |
| マゼンタ | [1 0 1] | [255 0 255] |
| シアン | [0 1 1] | [0 255 255] |
| 赤 | [1 0 0] | [255 0 0] |
| 緑 | [0 1 0] | [0 255 0] |
| 青 | [0 0 1] | [0 0 255] |
| 白 | [1 1 1] | [255 255 255] |
| 黒 | [0 0 0] | [0 0 0] |
データ型: char | double | single | uint8
target — ターゲット
Figure オブジェクト | Axes オブジェクト | PolarAxes オブジェクト | GeographicAxes オブジェクト | スタンドアロンの可視化
ターゲット。次の値のいずれかとして指定します。
Figureオブジェクト。Figure のカラーマップは、Figure 内のすべての座標軸のプロットに適用されます。Axesオブジェクト、PolarAxesオブジェクト、またはGeographicAxesオブジェクト。Figure 内の異なる座標軸に対して、固有のカラーマップを定義できます。Colormapプロパティをもつスタンドアロンの可視化。たとえば、HeatmapChartオブジェクトのカラーマップの変更またはクエリができます。
出力引数
詳細
カラーマップ
"カラーマップ" とは、surface、image および patch の各オブジェクトのようなグラフィックス オブジェクトの色を定義する値の行列です。MATLAB® は、データ値をカラーマップ内の色にマップして、オブジェクトを描画します。
カラーマップの長さは任意ですが、幅は 3 列でなければなりません。行列の各行は、RGB 3 成分を使用して 1 色を定義します。RGB 3 成分は、色の赤、緑、青成分の強度を指定する 3 成分の行ベクトルです。通常、強度値は範囲 [0, 1] の double 値または single 値です。0 の値は色なし、1 の値は最大強度を表します。たとえば、このコマンドは、黒、赤、緑、青、白の 5 色をもつカラーマップを作成します。
mymap = [0 0 0
    1 0 0
    0 1 0
    0 0 1
    1 1 1];
可視化のカラー スキームを変更するには、関数 colormap を呼び出して、座標軸または Figure を含むカラーマップを変更します。たとえば、次のコマンドは表面プロットを作成し、Figure のカラーマップを mymap に設定します。
surf(peaks)
colormap(mymap)
ヒント
カラーマップの範囲、およびこれらの範囲とデータの範囲との関連付けを制御するには、関数
climを使用します。R2022a より前:
caxisを使用します。その構文と引数はclimと同じです。
バージョン履歴
R2006a より前に導入You can also select a web site from the following list:
Americas
- América Latina (Español)
- Canada (English)
- United States (English)
Europe
- Belgium (English)
- Denmark (English)
- Deutschland (Deutsch)
- España (Español)
- Finland (English)
- France (Français)
- Ireland (English)
- Italia (Italiano)
- Luxembourg (English)
- Netherlands (English)
- Norway (English)
- Österreich (Deutsch)
- Portugal (English)
- Sweden (English)
- Switzerland
- United Kingdom (English)